Log entries by program:
| Program name | Lines | %Lines | Size | %Size |
|---|---|---|---|---|
| innfeed | 5128 | 55.4% | 500.5 KB | 44.0% |
| cnfsstat | 2448 | 26.4% | 434.0 KB | 38.1% |
| innd | 1544 | 16.7% | 191.7 KB | 16.8% |
| nnrpd | 127 | 1.4% | 10.5 KB | 0.9% |
| inn | 6 | 0.1% | 1.1 KB | 0.1% |
| nocem | 2 | 0.0% | 0.1 KB | 0.0% |
| controlchan | 2 | 0.0% | 0.1 KB | 0.0% |
| TOTAL: 7 | 9257 | 100.0% | 1.1 MB | 100.0% |
History cache:
| Reason | Count | %Count |
|---|---|---|
| Negative hits | 6 | 35.3% |
| Do not exist | 6 | 35.3% |
| Positive hits | 4 | 23.5% |
| Cache misses | 1 | 5.9% |
| TOTAL: 4 | 17 | 100.0% |
INND timer:
| Code region | Time | Pct | Invoked | Min(ms) | Avg(ms) | Max(ms) |
|---|---|---|---|---|---|---|
| artcncl/perl | 00:00:00.000 | 0.0% | 0 | 0.000 | 0.000 | 0.000 |
| article cancel | 00:00:00.000 | 0.0% | 0 | 0.000 | 0.000 | 0.000 |
| article cleanup | 00:00:00.000 | 0.0% | 6 | 0.000 | 0.000 | 0.000 |
| article logging | 00:00:00.001 | 0.0% | 6 | 0.000 | 0.167 | 1.000 |
| article parse | 00:00:00.001 | 0.0% | 12 | 0.000 | 0.083 | 0.167 |
| article write | 00:00:00.011 | 0.0% | 6 | 0.000 | 1.833 | 4.500 |
| artlog/artcncl | 00:00:00.000 | 0.0% | 0 | 0.000 | 0.000 | 0.000 |
| artlog/artcncl/perl | 00:00:00.000 | 0.0% | 0 | 0.000 | 0.000 | 0.000 |
| data move | 00:00:00.000 | 0.0% | 15 | 0.000 | 0.000 | 0.000 |
| hisgrep/artcncl | 00:00:00.000 | 0.0% | 0 | 0.000 | 0.000 | 0.000 |
| hisgrep/artcncl/perl | 00:00:00.000 | 0.0% | 0 | 0.000 | 0.000 | 0.000 |
| hisgrep/perl | 00:00:00.000 | 0.0% | 0 | 0.000 | 0.000 | 0.000 |
| hishave/artcncl | 00:00:00.000 | 0.0% | 0 | 0.000 | 0.000 | 0.000 |
| hishave/artcncl/perl | 00:00:00.000 | 0.0% | 0 | 0.000 | 0.000 | 0.000 |
| history grep | 00:00:00.000 | 0.0% | 0 | 0.000 | 0.000 | 0.000 |
| history lookup | 00:00:00.001 | 0.0% | 17 | 0.000 | 0.059 | 0.200 |
| history sync | 00:00:00.005 | 0.0% | 428 | 0.000 | 0.012 | 0.333 |
| history write | 00:00:00.004 | 0.0% | 6 | 0.000 | 0.667 | 3.000 |
| idle | 23:51:25.657 | 100.0% | 1120 | 19972.000 | 76683.622 | 100171.333 |
| nntp read | 00:00:00.005 | 0.0% | 53 | 0.000 | 0.094 | 1.000 |
| overview write | 00:00:00.011 | 0.0% | 6 | 0.500 | 1.833 | 5.000 |
| perl filter | 00:00:00.171 | 0.0% | 6 | 17.000 | 28.500 | 61.000 |
| python filter | 00:00:00.000 | 0.0% | 10 | 0.000 | 0.000 | 0.000 |
| site send | 00:00:00.038 | 0.0% | 18 | 0.000 | 2.111 | 2.556 |
| TOTAL: 23:51:36.836 | 23:51:25.905 | 100.0% | - | - | - | - |
INNfeed timer:
| Code region | Time | Pct | Invoked | Min(ms) | Avg(ms) | Max(ms) |
|---|---|---|---|---|---|---|
| article new | 00:00:00.000 | 0.0% | 7 | 0.000 | 0.000 | 0.000 |
| article prepare | 00:00:00.001 | 0.0% | 20 | 0.000 | 0.050 | 0.083 |
| article read | 00:00:00.001 | 0.0% | 5 | 0.000 | 0.200 | 0.333 |
| backlog stats | 00:00:00.066 | 0.0% | 6803 | 0.000 | 0.010 | 0.065 |
| callbacks | 00:00:00.000 | 0.0% | 0 | 0.000 | 0.000 | 0.000 |
| data read | 00:00:00.000 | 0.0% | 24 | 0.000 | 0.000 | 0.000 |
| data write | 00:00:00.003 | 0.0% | 98 | 0.000 | 0.031 | 0.250 |
| idle | 23:40:28.122 | 99.8% | 6803 | 6250.510 | 12528.020 | 26262.667 |
| status file | 00:00:03.592 | 0.0% | 938 | 3.000 | 3.829 | 7.000 |
| TOTAL: 23:42:57.582 | 23:40:31.785 | 99.8% | - | - | - | - |
nnrpd timer:
| Code region | Time | Pct | Invoked | Min(ms) | Avg(ms) | Max(ms) |
|---|---|---|---|---|---|---|
| idle | 06:04:41.721 | 100.0% | 339 | 7.286 | 64547.850 | 136685.588 |
| newnews | 00:00:00.000 | 0.0% | 0 | 0.000 | 0.000 | 0.000 |
| nntpwrite | 00:00:02.196 | 0.0% | 122556 | 0.000 | 0.018 | 1.472 |
| readart | 00:00:00.006 | 0.0% | 16 | 0.222 | 0.375 | 0.571 |
| TOTAL: 06:04:52.488 | 06:04:43.923 | 100.0% | - | - | - | - |
Control commands to INND:
| Command | Number |
|---|---|
| flush | 5 |
| flushlogs | 2 |
| go | 2 |
| logmode | 2 |
| lowmark | 1 |
| mode | 855 |
| name | 2 |
| pause | 2 |
| paused | 2 |
| reload | 2 |
| reserve | 2 |
| shutdown | 3 |
| TOTAL: 12 | 880 |
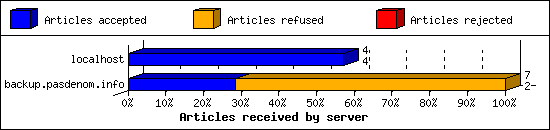
Incoming Feeds (INN):
| Server | Connects | Offered | Taken | Refused | Reject | %Accpt | Elapsed | |
|---|---|---|---|---|---|---|---|---|
| 1 | localhost | 31 | 4 | 4 | 0 | 0 | 100% | 00:00:00 |
| 2 | backup.pasdenom.info | 4 | 7 | 2 | 5 | 0 | 28% | 00:33:09 |
| TOTAL: 2 | 35 | 11 | 6 | 5 | 0 | 54% | 00:33:09 | |
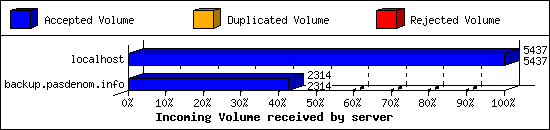
Incoming Volume (INN):
| Server | AcceptVol | DupVol | RejVol | TotalVol | %Acc | Vol/Art | |
|---|---|---|---|---|---|---|---|
| 1 | localhost | 5.3 KB | 0.0 KB | 0.0 KB | 5.3 KB | 100% | 1.3 KB |
| 2 | backup.pasdenom.info | 2.3 KB | 0.0 KB | 0.0 KB | 2.3 KB | 100% | 1.1 KB |
| TOTAL: 2 | 7.6 KB | 0.0 KB | 0.0 KB | 7.6 KB | 100% | 1.3 KB | |
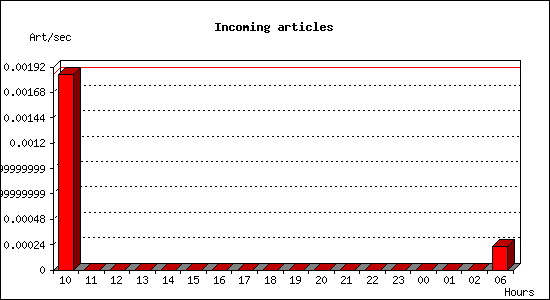
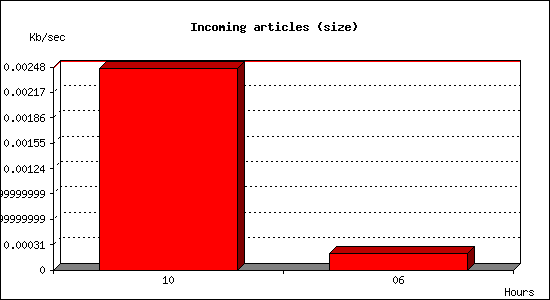
Incoming articles:
| Date | Articles | %Arts | Art/sec | Size | %Size | KB/sec |
|---|---|---|---|---|---|---|
| Feb 13 10:15:02 - 10:59:59 | 5 | 83.3% | 0.00 | 6.6 KB | 0.0% | 0.00 |
| Feb 13 11:00:00 - 11:59:59 | 0 | 0.0% | 0.00 | 0.0 KB | 0.0% | 0.00 |
| Feb 13 12:00:00 - 12:59:59 | 0 | 0.0% | 0.00 | 0.0 KB | 0.0% | 0.00 |
| Feb 13 13:00:00 - 13:59:59 | 0 | 0.0% | 0.00 | 0.0 KB | 0.0% | 0.00 |
| Feb 13 14:00:00 - 14:59:59 | 0 | 0.0% | 0.00 | 0.0 KB | 0.0% | 0.00 |
| Feb 13 15:00:00 - 15:59:59 | 0 | 0.0% | 0.00 | 0.0 KB | 0.0% | 0.00 |
| Feb 13 16:00:00 - 16:59:59 | 0 | 0.0% | 0.00 | 0.0 KB | 0.0% | 0.00 |
| Feb 13 17:00:00 - 17:59:59 | 0 | 0.0% | 0.00 | 0.0 KB | 0.0% | 0.00 |
| Feb 13 18:00:00 - 18:59:59 | 0 | 0.0% | 0.00 | 0.0 KB | 0.0% | 0.00 |
| Feb 13 19:00:00 - 19:59:59 | 0 | 0.0% | 0.00 | 0.0 KB | 0.0% | 0.00 |
| Feb 13 20:00:00 - 20:59:59 | 0 | 0.0% | 0.00 | 0.0 KB | 0.0% | 0.00 |
| Feb 13 21:00:00 - 21:59:59 | 0 | 0.0% | 0.00 | 0.0 KB | 0.0% | 0.00 |
| Feb 13 22:00:00 - 22:59:59 | 0 | 0.0% | 0.00 | 0.0 KB | 0.0% | 0.00 |
| Feb 13 23:00:00 - 23:59:59 | 0 | 0.0% | 0.00 | 0.0 KB | 0.0% | 0.00 |
| Feb 14 00:00:00 - 00:59:59 | 0 | 0.0% | 0.00 | 0.0 KB | 0.0% | 0.00 |
| Feb 14 01:00:00 - 01:59:59 | 0 | 0.0% | 0.00 | 0.0 KB | 0.0% | 0.00 |
| Feb 14 02:00:00 - 02:59:59 | 0 | 0.0% | 0.00 | 0.0 KB | 0.0% | 0.00 |
| Feb 14 03:00:00 - 06:15:02 | 1 | 16.7% | 0.00 | 0.9 KB | 0.0% | 0.00 |
| TOTAL: 18:00:00 | 6 | 100.0% | 0.00 | 0.0 KB | 100.0% | 0.00 |
CNFS buffer status:
| Buffer | Class | Size | Used | %Used | Cycles | KB/sec | Days |
|---|---|---|---|---|---|---|---|
| ALT1 | M_ALT | 1000.0 MB | 963.4 MB | 96.3% | 2 | 0.00 | 0.00 |
| ALTFR1 | M_ALTFR | 500.0 MB | 148.4 MB | 29.7% | 0 | 0.00 | 0.00 |
| BIG1 | M_BIG8 | 2.0 GB | 1.9 GB | 97.7% | 14 | 0.00 | 0.00 |
| BIG2 | M_BIG8 | 2.0 GB | 1.9 GB | 97.9% | 14 | 0.00 | 0.00 |
| BIG3 | M_BIG8 | 2.0 GB | 1.6 GB | 81.7% | 11 | 0.00 | 0.00 |
| BIN0 | M_BIN | 500.0 MB | 336.8 MB | 67.3% | 1 | 0.00 | 0.00 |
| CTRL1 | M_CTRL | 100.0 MB | 42.0 MB | 42.0% | 24 | 0.00 | 0.00 |
| EUROPE1 | M_EUR | 2.0 GB | 1.7 GB | 87.1% | 39 | 0.00 | 0.00 |
| FR1 | M_FR | 2.0 GB | 469.4 MB | 23.5% | 2 | 0.00 | 0.00 |
| FR2 | M_FR | 2.0 GB | 441.9 MB | 22.1% | 1 | 0.00 | 0.00 |
| FREE1 | M_FREE | 1000.0 MB | 543.7 MB | 54.4% | 23 | 0.00 | 0.00 |
| MAIL0 | M_MAIL | 500.0 MB | 197.8 MB | 39.6% | 27 | 0.00 | 0.00 |
| MHUU1 | M_MHUU | 2.0 GB | 11.9 MB | 0.6% | 36 | 0.00 | 0.00 |
| MHUU2 | M_MHUU | 2.0 GB | 26.9 MB | 1.3% | 27 | 0.00 | 0.00 |
| MIC0 | M_MIC | 100.0 MB | 35.2 MB | 35.2% | 12 | 0.00 | 0.00 |
| RUS1 | M_RUS | 2.0 GB | 1.7 GB | 84.7% | 8 | 0.00 | 0.00 |
| TEST | M_TEST | 500.0 MB | 178.8 MB | 35.8% | 14 | 0.02 | 347.22 |
| TOTAL: 17 | - | 21.7 GB | 12.1 GB | 55.8% | 255 | 0.02 | - |
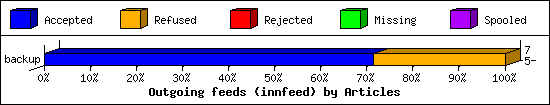
Outgoing Feeds (innfeed) by Articles:
| Server | Offered | Taken | Refused | Reject | Miss | Spool | %Took | Elapsed | |
|---|---|---|---|---|---|---|---|---|---|
| 1 | backup | 7 | 5 | 2 | 0 | 0 | 0 | 71% | 04:47:23 |
| 2 | dodin | 0 | 0 | 0 | 0 | 0 | 1 | 0% | 23:59:33 |
| 3 | alphanet | 0 | 0 | 0 | 0 | 0 | 1 | 0% | 23:59:33 |
| 4 | birotanews | 0 | 0 | 0 | 0 | 0 | 1 | 0% | 23:59:33 |
| 5 | bwh | 0 | 0 | 0 | 0 | 0 | 1 | 0% | 23:59:33 |
| 6 | linuxd | 0 | 0 | 0 | 0 | 0 | 1 | 0% | 23:59:17 |
| 7 | lightlink | 0 | 0 | 0 | 0 | 0 | 1 | 0% | 23:59:33 |
| 8 | aioe | 0 | 0 | 0 | 0 | 0 | 1 | 0% | 23:59:33 |
| 9 | tsukuba | 0 | 0 | 0 | 0 | 0 | 0 | 0% | 23:59:17 |
| 10 | goja | 0 | 0 | 0 | 0 | 0 | 1 | 0% | 23:59:17 |
| 11 | gegeweb | 0 | 0 | 0 | 0 | 0 | 1 | 0% | 23:59:33 |
| 12 | ortolo | 0 | 0 | 0 | 0 | 0 | 1 | 0% | 23:59:33 |
| 13 | free | 0 | 0 | 0 | 0 | 0 | 1 | 0% | 23:59:33 |
| 14 | glou | 0 | 0 | 0 | 0 | 0 | 1 | 0% | 23:59:33 |
| 15 | nntp4 | 0 | 0 | 0 | 0 | 0 | 1 | 0% | 23:59:33 |
| 16 | lysator | 0 | 0 | 0 | 0 | 0 | 1 | 0% | 23:59:33 |
| 17 | niel.me | 0 | 0 | 0 | 0 | 0 | 1 | 0% | 23:59:33 |
| 18 | furie | 0 | 0 | 0 | 0 | 0 | 0 | 0% | 23:59:33 |
| 19 | usenetovh | 0 | 0 | 0 | 0 | 0 | 1 | 0% | 23:59:33 |
| 20 | izac | 0 | 0 | 0 | 0 | 0 | 1 | 0% | 23:59:33 |
| 21 | kf5zxw.com | 0 | 0 | 0 | 0 | 0 | 1 | 0% | 23:59:33 |
| 22 | bete-des-vosges | 0 | 0 | 0 | 0 | 0 | 1 | 0% | 23:59:33 |
| 23 | httrack | 0 | 0 | 0 | 0 | 0 | 1 | 0% | 23:59:33 |
| 24 | tnet | 0 | 0 | 0 | 0 | 0 | 1 | 0% | 23:59:33 |
| 25 | usenet-fr | 0 | 0 | 0 | 0 | 0 | 1 | 0% | 23:59:33 |
| 26 | csiph | 0 | 0 | 0 | 0 | 0 | 1 | 0% | 23:59:33 |
| 27 | weretis.net | 0 | 0 | 0 | 0 | 0 | 1 | 0% | 23:59:33 |
| TOTAL: 27 | 7 | 5 | 2 | 0 | 0 | 24 | 71% | 628:34:53 | |
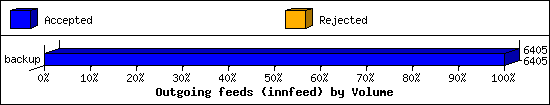
Outgoing Feeds (innfeed) by Volume:
| Server | AcceptVol | RejectVol | TotalVol | Volume/sec | Vol/Art | Elapsed | |
|---|---|---|---|---|---|---|---|
| 1 | backup | 6.3 KB | 0.0 KB | 6.3 KB | 0.0 KB/s | 1.3 KB | 04:47:23 |
| 2 | dodin | 0.0 KB | 0.0 KB | 0.0 KB | 0.0 KB/s | 0 | 23:59:33 |
| 3 | alphanet | 0.0 KB | 0.0 KB | 0.0 KB | 0.0 KB/s | 0 | 23:59:33 |
| 4 | birotanews | 0.0 KB | 0.0 KB | 0.0 KB | 0.0 KB/s | 0 | 23:59:33 |
| 5 | bwh | 0.0 KB | 0.0 KB | 0.0 KB | 0.0 KB/s | 0 | 23:59:33 |
| 6 | linuxd | 0.0 KB | 0.0 KB | 0.0 KB | 0.0 KB/s | 0 | 23:59:17 |
| 7 | lightlink | 0.0 KB | 0.0 KB | 0.0 KB | 0.0 KB/s | 0 | 23:59:33 |
| 8 | aioe | 0.0 KB | 0.0 KB | 0.0 KB | 0.0 KB/s | 0 | 23:59:33 |
| 9 | tsukuba | 0.0 KB | 0.0 KB | 0.0 KB | 0.0 KB/s | 0 | 23:59:17 |
| 10 | goja | 0.0 KB | 0.0 KB | 0.0 KB | 0.0 KB/s | 0 | 23:59:17 |
| 11 | gegeweb | 0.0 KB | 0.0 KB | 0.0 KB | 0.0 KB/s | 0 | 23:59:33 |
| 12 | ortolo | 0.0 KB | 0.0 KB | 0.0 KB | 0.0 KB/s | 0 | 23:59:33 |
| 13 | free | 0.0 KB | 0.0 KB | 0.0 KB | 0.0 KB/s | 0 | 23:59:33 |
| 14 | glou | 0.0 KB | 0.0 KB | 0.0 KB | 0.0 KB/s | 0 | 23:59:33 |
| 15 | nntp4 | 0.0 KB | 0.0 KB | 0.0 KB | 0.0 KB/s | 0 | 23:59:33 |
| 16 | lysator | 0.0 KB | 0.0 KB | 0.0 KB | 0.0 KB/s | 0 | 23:59:33 |
| 17 | niel.me | 0.0 KB | 0.0 KB | 0.0 KB | 0.0 KB/s | 0 | 23:59:33 |
| 18 | furie | 0.0 KB | 0.0 KB | 0.0 KB | 0.0 KB/s | 0 | 23:59:33 |
| 19 | usenetovh | 0.0 KB | 0.0 KB | 0.0 KB | 0.0 KB/s | 0 | 23:59:33 |
| 20 | izac | 0.0 KB | 0.0 KB | 0.0 KB | 0.0 KB/s | 0 | 23:59:33 |
| 21 | kf5zxw.com | 0.0 KB | 0.0 KB | 0.0 KB | 0.0 KB/s | 0 | 23:59:33 |
| 22 | bete-des-vosges | 0.0 KB | 0.0 KB | 0.0 KB | 0.0 KB/s | 0 | 23:59:33 |
| 23 | httrack | 0.0 KB | 0.0 KB | 0.0 KB | 0.0 KB/s | 0 | 23:59:33 |
| 24 | tnet | 0.0 KB | 0.0 KB | 0.0 KB | 0.0 KB/s | 0 | 23:59:33 |
| 25 | usenet-fr | 0.0 KB | 0.0 KB | 0.0 KB | 0.0 KB/s | 0 | 23:59:33 |
| 26 | csiph | 0.0 KB | 0.0 KB | 0.0 KB | 0.0 KB/s | 0 | 23:59:33 |
| 27 | weretis.net | 0.0 KB | 0.0 KB | 0.0 KB | 0.0 KB/s | 0 | 23:59:33 |
| TOTAL: 27 | 6.3 KB | 0.0 KB | 6.3 KB | 0.0 KB/s | 1.3 KB | 628:34:53 | |
NNRP readership statistics:
| System | Conn | Arts | Size | Groups | Post | Rej | Elapsed | |
|---|---|---|---|---|---|---|---|---|
| 1 | 192.168.0.26 | 5 | 9 | 21.3 KB | 1 | 0 | 0 | 03:24:44 |
| 2 | 192.168.0.7 | 4 | 7 | 9.9 KB | 3 | 2 | 0 | 02:40:06 |
| 3 | localhost | 2 | 0 | 0.0 KB | 0 | 2 | 0 | 00:00:01 |
| TOTAL: 3 | 11 | 16 | 31.2 KB | 4 | 4 | 0 | 06:04:51 | |
NNRP readership statistics (by domain):
| System | Conn | Arts | Size | Groups | Post | Rej | Elapsed | |
|---|---|---|---|---|---|---|---|---|
| 1 | unresolved | 9 | 16 | 31.2 KB | 4 | 2 | 0 | 06:04:50 |
| 2 | ? | 2 | 0 | 0.0 KB | 0 | 2 | 0 | 00:00:01 |
| TOTAL: 2 | 11 | 16 | 31.2 KB | 4 | 4 | 0 | 06:04:51 | |
NNRP total resource statistics [Top 20]:
| System | User(ms) | System(ms) | Idle(ms) | Elapsed |
|---|---|---|---|---|
| 192.168.0.26 | 2.865 | 0.865 | 0.000 | 03:24:44 |
| 192.168.0.7 | 2.252 | 2.855 | 0.000 | 02:40:06 |
| localhost | 0.847 | 0.141 | 0.000 | 00:00:01 |
| TOTAL: 3 | 5.964 | 3.861 | 0.000 | 06:04:51 |
NNRP client timeouts [Top 20]:
| System | Conn | Peer |
|---|---|---|
| 192.168.0.26 | 5 | 0 |
| 192.168.0.7 | 4 | 0 |
| TOTAL: 2 | 9 | 0 |
Newsgroup request counts (by category):
| Category | Count | Pct | |
|---|---|---|---|
| 1 | fr | 11 | 68.8% |
| 2 | nemo | 5 | 31.2% |
| TOTAL: 2 | 16 | 100.0% | |
Newsgroup request counts (by newsgroup) [Top 200]:
| Newsgroup | Count | |
|---|---|---|
| 1 | fr.comp.usenet.lecteurs-de-news | 9 |
| 2 | nemo.test | 5 |
| 3 | fr.test | 2 |
| TOTAL: 3 | 16 | |