Unknown entries from news log file:
First 1 / 1 lines (100.0%)
Log entries by program:
| Program name | Lines | %Lines | Size | %Size |
|---|---|---|---|---|
| nnrpd | 39021 | 82.5% | 2.9 MB | 73.7% |
| innfeed | 4097 | 8.7% | 397.5 KB | 9.9% |
| cnfsstat | 2448 | 5.2% | 435.1 KB | 10.8% |
| innd | 1667 | 3.5% | 218.3 KB | 5.4% |
| inn | 35 | 0.1% | 4.0 KB | 0.1% |
| nocem | 1 | 0.0% | 0.0 KB | 0.0% |
| controlchan | 1 | 0.0% | 0.1 KB | 0.0% |
| TOTAL: 7 | 47270 | 100.0% | 3.9 MB | 100.0% |
History cache:
| Reason | Count | %Count |
|---|---|---|
| Cache misses | 31 | 77.5% |
| Negative hits | 3 | 7.5% |
| Positive hits | 3 | 7.5% |
| Do not exist | 3 | 7.5% |
| TOTAL: 4 | 40 | 100.0% |
INND timer:
| Code region | Time | Pct | Invoked | Min(ms) | Avg(ms) | Max(ms) |
|---|---|---|---|---|---|---|
| article cancel | 00:00:00.031 | 0.0% | 33 | 0.643 | 0.939 | 2.000 |
| article cleanup | 00:00:00.001 | 0.0% | 3 | 0.000 | 0.333 | 0.500 |
| article logging | 00:00:00.001 | 0.0% | 3 | 0.000 | 0.333 | 0.500 |
| article parse | 00:00:00.000 | 0.0% | 9 | 0.000 | 0.000 | 0.000 |
| article write | 00:00:00.000 | 0.0% | 3 | 0.000 | 0.000 | 0.000 |
| artlog/artcncl | 00:00:00.001 | 0.0% | 32 | 0.000 | 0.031 | 0.167 |
| data move | 00:00:00.000 | 0.0% | 10 | 0.000 | 0.000 | 0.000 |
| hisgrep/artcncl | 00:00:00.003 | 0.0% | 32 | 0.000 | 0.094 | 0.167 |
| hishave/artcncl | 00:00:00.005 | 0.0% | 32 | 0.000 | 0.156 | 1.000 |
| history grep | 00:00:00.000 | 0.0% | 0 | 0.000 | 0.000 | 0.000 |
| history lookup | 00:00:00.000 | 0.0% | 8 | 0.000 | 0.000 | 0.000 |
| history sync | 00:00:00.004 | 0.0% | 432 | 0.000 | 0.009 | 0.333 |
| history write | 00:00:00.001 | 0.0% | 3 | 0.000 | 0.333 | 1.000 |
| idle | 24:01:33.856 | 100.0% | 1235 | 9535.127 | 70035.511 | 100170.667 |
| nntp read | 00:00:00.004 | 0.0% | 78 | 0.000 | 0.051 | 0.500 |
| overview write | 00:00:00.006 | 0.0% | 3 | 2.000 | 2.000 | 2.000 |
| perl filter | 00:00:00.103 | 0.0% | 3 | 11.000 | 34.333 | 81.000 |
| python filter | 00:00:00.000 | 0.0% | 6 | 0.000 | 0.000 | 0.000 |
| site send | 00:00:00.014 | 0.0% | 9 | 0.333 | 1.556 | 2.167 |
| TOTAL: 24:01:42.013 | 24:01:34.030 | 100.0% | - | - | - | - |
INNfeed timer:
| Code region | Time | Pct | Invoked | Min(ms) | Avg(ms) | Max(ms) |
|---|---|---|---|---|---|---|
| article new | 00:00:00.000 | 0.0% | 3 | 0.000 | 0.000 | 0.000 |
| article prepare | 00:00:00.000 | 0.0% | 12 | 0.000 | 0.000 | 0.000 |
| article read | 00:00:00.001 | 0.0% | 3 | 0.000 | 0.333 | 0.500 |
| backlog stats | 00:00:00.044 | 0.0% | 6092 | 0.000 | 0.007 | 0.071 |
| callbacks | 00:00:00.000 | 0.0% | 0 | 0.000 | 0.000 | 0.000 |
| data read | 00:00:00.000 | 0.0% | 18 | 0.000 | 0.000 | 0.000 |
| data write | 00:00:00.001 | 0.0% | 83 | 0.000 | 0.012 | 0.167 |
| idle | 23:48:53.079 | 99.9% | 6092 | 7204.940 | 14073.060 | 30016.762 |
| status file | 00:00:02.291 | 0.0% | 695 | 3.000 | 3.296 | 11.000 |
| TOTAL: 23:50:39.699 | 23:48:55.416 | 99.9% | - | - | - | - |
nnrpd timer:
| Code region | Time | Pct | Invoked | Min(ms) | Avg(ms) | Max(ms) |
|---|---|---|---|---|---|---|
| hisgrep | 00:00:00.003 | 0.0% | 32 | 0.000 | 0.094 | 1.000 |
| idle | 02:08:34.252 | 36.3% | 4927 | 0.208 | 1565.710 | 362622.000 |
| newnews | 00:00:00.000 | 0.0% | 0 | 0.000 | 0.000 | 0.000 |
| nntpwrite | 00:00:04.106 | 0.0% | 78495 | 0.000 | 0.052 | 1.000 |
| readart | 00:00:00.303 | 0.0% | 168 | 0.000 | 1.804 | 66.667 |
| TOTAL: 05:54:35.200 | 02:08:38.664 | 36.3% | - | - | - | - |
Control commands to INND:
| Command | Number |
|---|---|
| cancel | 33 |
| flush | 5 |
| flushlogs | 2 |
| go | 2 |
| logmode | 2 |
| lowmark | 1 |
| mode | 855 |
| name | 2 |
| pause | 2 |
| paused | 2 |
| reload | 2 |
| reserve | 2 |
| TOTAL: 12 | 910 |
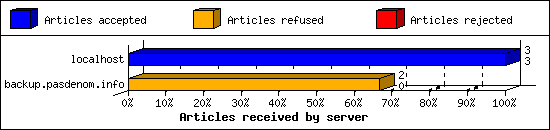
Incoming Feeds (INN):
| Server | Connects | Offered | Taken | Refused | Reject | %Accpt | Elapsed | |
|---|---|---|---|---|---|---|---|---|
| 1 | localhost | 63 | 3 | 3 | 0 | 0 | 100% | 00:00:00 |
| 2 | backup.pasdenom.info | 2 | 2 | 0 | 2 | 0 | 0% | 00:20:00 |
| TOTAL: 2 | 65 | 5 | 3 | 2 | 0 | 60% | 00:20:00 | |
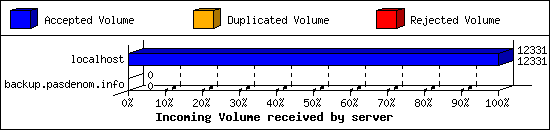
Incoming Volume (INN):
| Server | AcceptVol | DupVol | RejVol | TotalVol | %Acc | Vol/Art | |
|---|---|---|---|---|---|---|---|
| 1 | localhost | 12.0 KB | 0.0 KB | 0.0 KB | 12.0 KB | 100% | 4.0 KB |
| 2 | backup.pasdenom.info | 0.0 KB | 0.0 KB | 0.0 KB | 0.0 KB | 0% | 0 |
| TOTAL: 2 | 12.0 KB | 0.0 KB | 0.0 KB | 12.0 KB | 100% | 4.0 KB | |
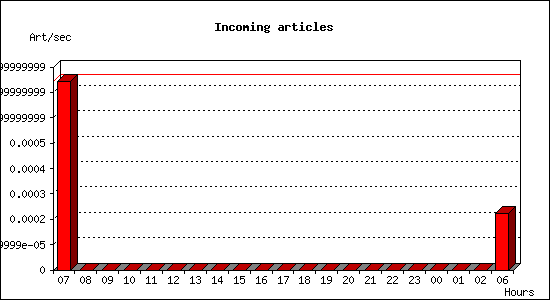
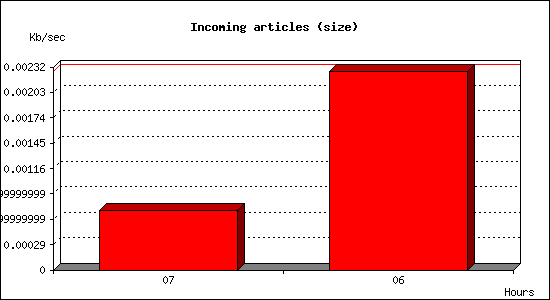
Incoming articles:
| Date | Articles | %Arts | Art/sec | Size | %Size | KB/sec |
|---|---|---|---|---|---|---|
| Sep 2 07:15:02 - 07:59:59 | 2 | 66.7% | 0.00 | 1.8 KB | 0.0% | 0.00 |
| Sep 2 08:00:00 - 08:59:59 | 0 | 0.0% | 0.00 | 0.0 KB | 0.0% | 0.00 |
| Sep 2 09:00:00 - 09:59:59 | 0 | 0.0% | 0.00 | 0.0 KB | 0.0% | 0.00 |
| Sep 2 10:00:00 - 10:59:59 | 0 | 0.0% | 0.00 | 0.0 KB | 0.0% | 0.00 |
| Sep 2 11:00:00 - 11:59:59 | 0 | 0.0% | 0.00 | 0.0 KB | 0.0% | 0.00 |
| Sep 2 12:00:00 - 12:59:59 | 0 | 0.0% | 0.00 | 0.0 KB | 0.0% | 0.00 |
| Sep 2 13:00:00 - 13:59:59 | 0 | 0.0% | 0.00 | 0.0 KB | 0.0% | 0.00 |
| Sep 2 14:00:00 - 14:59:59 | 0 | 0.0% | 0.00 | 0.0 KB | 0.0% | 0.00 |
| Sep 2 15:00:00 - 15:59:59 | 0 | 0.0% | 0.00 | 0.0 KB | 0.0% | 0.00 |
| Sep 2 16:00:00 - 16:59:59 | 0 | 0.0% | 0.00 | 0.0 KB | 0.0% | 0.00 |
| Sep 2 17:00:00 - 17:59:59 | 0 | 0.0% | 0.00 | 0.0 KB | 0.0% | 0.00 |
| Sep 2 18:00:00 - 18:59:59 | 0 | 0.0% | 0.00 | 0.0 KB | 0.0% | 0.00 |
| Sep 2 19:00:00 - 19:59:59 | 0 | 0.0% | 0.00 | 0.0 KB | 0.0% | 0.00 |
| Sep 2 20:00:00 - 20:59:59 | 0 | 0.0% | 0.00 | 0.0 KB | 0.0% | 0.00 |
| Sep 2 21:00:00 - 21:59:59 | 0 | 0.0% | 0.00 | 0.0 KB | 0.0% | 0.00 |
| Sep 2 22:00:00 - 22:59:59 | 0 | 0.0% | 0.00 | 0.0 KB | 0.0% | 0.00 |
| Sep 2 23:00:00 - 23:59:59 | 0 | 0.0% | 0.00 | 0.0 KB | 0.0% | 0.00 |
| Sep 3 00:00:00 - 00:59:59 | 0 | 0.0% | 0.00 | 0.0 KB | 0.0% | 0.00 |
| Sep 3 01:00:00 - 01:59:59 | 0 | 0.0% | 0.00 | 0.0 KB | 0.0% | 0.00 |
| Sep 3 02:00:00 - 02:59:59 | 0 | 0.0% | 0.00 | 0.0 KB | 0.0% | 0.00 |
| Sep 3 03:00:00 - 06:15:01 | 1 | 33.3% | 0.00 | 10.2 KB | 0.0% | 0.00 |
| TOTAL: 20:59:59 | 3 | 100.0% | 0.00 | 0.0 KB | 100.0% | 0.00 |
CNFS buffer status:
| Buffer | Class | Size | Used | %Used | Cycles | KB/sec | Days |
|---|---|---|---|---|---|---|---|
| ALT1 | M_ALT | 1000.0 MB | 945.5 MB | 94.6% | 2 | 0.00 | 0.00 |
| ALTFR1 | M_ALTFR | 500.0 MB | 147.7 MB | 29.5% | 0 | 0.00 | 0.00 |
| BIG1 | M_BIG8 | 2.0 GB | 1.4 GB | 69.4% | 14 | 0.00 | 0.00 |
| BIG2 | M_BIG8 | 2.0 GB | 1.4 GB | 69.6% | 14 | 0.00 | 0.00 |
| BIG3 | M_BIG8 | 2.0 GB | 1.0 GB | 53.4% | 11 | 0.00 | 0.00 |
| BIN0 | M_BIN | 500.0 MB | 237.2 MB | 47.4% | 1 | 0.02 | 347.22 |
| CTRL1 | M_CTRL | 100.0 MB | 16.1 MB | 16.1% | 24 | 0.00 | 0.00 |
| EUROPE1 | M_EUR | 2.0 GB | 93.5 MB | 4.7% | 39 | 0.00 | 0.00 |
| FR1 | M_FR | 2.0 GB | 469.4 MB | 23.5% | 2 | 0.00 | 0.00 |
| FR2 | M_FR | 2.0 GB | 441.9 MB | 22.1% | 1 | 0.00 | 0.00 |
| FREE1 | M_FREE | 1000.0 MB | 393.9 MB | 39.4% | 23 | 0.00 | 0.00 |
| MAIL0 | M_MAIL | 500.0 MB | 197.6 MB | 39.5% | 27 | 0.00 | 0.00 |
| MHUU1 | M_MHUU | 2.0 GB | 817.5 MB | 40.9% | 35 | 0.00 | 0.00 |
| MHUU2 | M_MHUU | 2.0 GB | 832.6 MB | 41.6% | 26 | 0.00 | 0.00 |
| MIC0 | M_MIC | 100.0 MB | 174.1 KB | 0.2% | 12 | 0.00 | 0.00 |
| RUS1 | M_RUS | 2.0 GB | 1.5 GB | 78.8% | 8 | 0.00 | 0.00 |
| TEST | M_TEST | 500.0 MB | 458.1 MB | 91.6% | 13 | 0.00 | 0.00 |
| TOTAL: 17 | - | 21.7 GB | 10.2 GB | 47.2% | 252 | 0.02 | - |
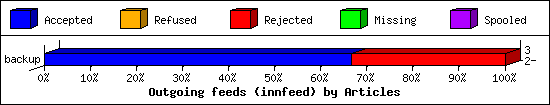
Outgoing Feeds (innfeed) by Articles:
| Server | Offered | Taken | Refused | Reject | Miss | Spool | %Took | Elapsed | |
|---|---|---|---|---|---|---|---|---|---|
| 1 | backup | 3 | 2 | 0 | 1 | 0 | 0 | 66% | 00:30:03 |
| 2 | furie | 0 | 0 | 0 | 0 | 0 | 0 | 0% | 23:59:59 |
| 3 | linuxd | 0 | 0 | 0 | 0 | 0 | 0 | 0% | 23:59:52 |
| 4 | csiph | 0 | 0 | 0 | 0 | 0 | 0 | 0% | 23:59:59 |
| 5 | dodin | 0 | 0 | 0 | 0 | 0 | 0 | 0% | 23:59:59 |
| 6 | birotanews | 0 | 0 | 0 | 0 | 0 | 0 | 0% | 23:59:59 |
| 7 | goja | 0 | 0 | 0 | 0 | 0 | 0 | 0% | 23:59:52 |
| 8 | nntp4 | 0 | 0 | 0 | 0 | 0 | 0 | 0% | 23:59:59 |
| 9 | niel.me | 0 | 0 | 0 | 0 | 0 | 0 | 0% | 23:59:59 |
| 10 | ortolo | 0 | 0 | 0 | 0 | 0 | 0 | 0% | 23:59:59 |
| 11 | tnet | 0 | 0 | 0 | 0 | 0 | 0 | 0% | 23:59:59 |
| 12 | gegeweb | 0 | 0 | 0 | 0 | 0 | 0 | 0% | 23:59:59 |
| 13 | aioe | 0 | 0 | 0 | 0 | 0 | 0 | 0% | 23:59:59 |
| 14 | tsukuba | 0 | 0 | 0 | 0 | 0 | 0 | 0% | 23:59:52 |
| 15 | usenet-fr | 0 | 0 | 0 | 0 | 0 | 0 | 0% | 23:59:59 |
| 16 | weretis.net | 0 | 0 | 0 | 0 | 0 | 0 | 0% | 23:59:59 |
| 17 | bete-des-vosges | 0 | 0 | 0 | 0 | 0 | 0 | 0% | 23:59:59 |
| 18 | izac | 0 | 0 | 0 | 0 | 0 | 0 | 0% | 23:59:59 |
| 19 | free | 0 | 0 | 0 | 0 | 0 | 0 | 0% | 23:59:59 |
| 20 | httrack | 0 | 0 | 0 | 0 | 0 | 0 | 0% | 23:59:59 |
| 21 | alphanet | 0 | 0 | 0 | 0 | 0 | 0 | 0% | 23:59:59 |
| 22 | bwh | 0 | 0 | 0 | 0 | 0 | 0 | 0% | 23:59:59 |
| TOTAL: 22 | 3 | 2 | 0 | 1 | 0 | 0 | 66% | 504:29:21 | |
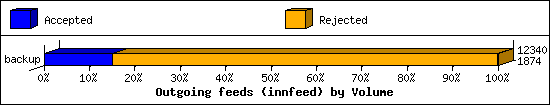
Outgoing Feeds (innfeed) by Volume:
| Server | AcceptVol | RejectVol | TotalVol | Volume/sec | Vol/Art | Elapsed | |
|---|---|---|---|---|---|---|---|
| 1 | backup | 1.8 KB | 10.2 KB | 12.1 KB | 0.0 KB/s | 4.0 KB | 00:30:03 |
| 2 | furie | 0.0 KB | 0.0 KB | 0.0 KB | 0.0 KB/s | 0 | 23:59:59 |
| 3 | linuxd | 0.0 KB | 0.0 KB | 0.0 KB | 0.0 KB/s | 0 | 23:59:52 |
| 4 | csiph | 0.0 KB | 0.0 KB | 0.0 KB | 0.0 KB/s | 0 | 23:59:59 |
| 5 | dodin | 0.0 KB | 0.0 KB | 0.0 KB | 0.0 KB/s | 0 | 23:59:59 |
| 6 | birotanews | 0.0 KB | 0.0 KB | 0.0 KB | 0.0 KB/s | 0 | 23:59:59 |
| 7 | goja | 0.0 KB | 0.0 KB | 0.0 KB | 0.0 KB/s | 0 | 23:59:52 |
| 8 | nntp4 | 0.0 KB | 0.0 KB | 0.0 KB | 0.0 KB/s | 0 | 23:59:59 |
| 9 | niel.me | 0.0 KB | 0.0 KB | 0.0 KB | 0.0 KB/s | 0 | 23:59:59 |
| 10 | ortolo | 0.0 KB | 0.0 KB | 0.0 KB | 0.0 KB/s | 0 | 23:59:59 |
| 11 | tnet | 0.0 KB | 0.0 KB | 0.0 KB | 0.0 KB/s | 0 | 23:59:59 |
| 12 | gegeweb | 0.0 KB | 0.0 KB | 0.0 KB | 0.0 KB/s | 0 | 23:59:59 |
| 13 | aioe | 0.0 KB | 0.0 KB | 0.0 KB | 0.0 KB/s | 0 | 23:59:59 |
| 14 | tsukuba | 0.0 KB | 0.0 KB | 0.0 KB | 0.0 KB/s | 0 | 23:59:52 |
| 15 | usenet-fr | 0.0 KB | 0.0 KB | 0.0 KB | 0.0 KB/s | 0 | 23:59:59 |
| 16 | weretis.net | 0.0 KB | 0.0 KB | 0.0 KB | 0.0 KB/s | 0 | 23:59:59 |
| 17 | bete-des-vosges | 0.0 KB | 0.0 KB | 0.0 KB | 0.0 KB/s | 0 | 23:59:59 |
| 18 | izac | 0.0 KB | 0.0 KB | 0.0 KB | 0.0 KB/s | 0 | 23:59:59 |
| 19 | free | 0.0 KB | 0.0 KB | 0.0 KB | 0.0 KB/s | 0 | 23:59:59 |
| 20 | httrack | 0.0 KB | 0.0 KB | 0.0 KB | 0.0 KB/s | 0 | 23:59:59 |
| 21 | alphanet | 0.0 KB | 0.0 KB | 0.0 KB | 0.0 KB/s | 0 | 23:59:59 |
| 22 | bwh | 0.0 KB | 0.0 KB | 0.0 KB | 0.0 KB/s | 0 | 23:59:59 |
| TOTAL: 22 | 1.8 KB | 10.2 KB | 12.1 KB | 0.0 KB/s | 4.0 KB | 504:29:21 | |
NNRP readership statistics:
| System | Conn | Arts | Size | Groups | Post | Rej | Elapsed | |
|---|---|---|---|---|---|---|---|---|
| 1 | localhost | 35 | 99 | 268.0 KB | 3 | 1 | 0 | 01:32:44 |
| 2 | 192.168.0.32 | 18 | 4 | 129.8 KB | 3 | 2 | 0 | 04:21:46 |
| TOTAL: 2 | 53 | 103 | 397.8 KB | 6 | 3 | 0 | 05:54:31 | |
NNRP readership statistics (by domain):
| System | Conn | Arts | Size | Groups | Post | Rej | Elapsed | |
|---|---|---|---|---|---|---|---|---|
| 1 | ? | 35 | 99 | 268.0 KB | 3 | 1 | 0 | 01:32:44 |
| 2 | unresolved | 18 | 4 | 129.8 KB | 3 | 2 | 0 | 04:21:46 |
| TOTAL: 2 | 53 | 103 | 397.8 KB | 6 | 3 | 0 | 05:54:31 | |
NNRP total resource statistics [Top 20]:
| System | User(ms) | System(ms) | Idle(ms) | Elapsed |
|---|---|---|---|---|
| 192.168.0.32 | 8.968 | 2.368 | 0.237 | 04:21:46 |
| localhost | 14.230 | 6.181 | 0.434 | 01:32:44 |
| TOTAL: 2 | 23.198 | 8.549 | 0.671 | 05:54:31 |
NNRP client timeouts [Top 20]:
| System | Conn | Peer |
|---|---|---|
| 192.168.0.32 | 3 | 0 |
| localhost | 1 | 0 |
| TOTAL: 2 | 4 | 0 |
Newsgroup request counts (by category):
| Category | Count | Pct | |
|---|---|---|---|
| 1 | alt | 50 | 69.4% |
| 2 | local | 18 | 25.0% |
| 3 | fr | 3 | 4.2% |
| 4 | control | 1 | 1.4% |
| TOTAL: 4 | 72 | 100.0% | |
Newsgroup request counts (by newsgroup) [Top 200]:
| Newsgroup | Count | |
|---|---|---|
| 1 | alt.fr.test.essai | 50 |
| 2 | local.nocem | 18 |
| 3 | fr.test | 3 |
| 4 | control.checkgroups | 1 |
| TOTAL: 4 | 72 | |