Log entries by program:
| Program name | Lines | %Lines | Size | %Size |
|---|---|---|---|---|
| innfeed | 4081 | 50.9% | 398.8 KB | 39.0% |
| cnfsstat | 2448 | 30.5% | 435.9 KB | 42.6% |
| innd | 1464 | 18.3% | 186.0 KB | 18.2% |
| nnrpd | 19 | 0.2% | 1.7 KB | 0.2% |
| inn | 2 | 0.0% | 0.4 KB | 0.0% |
| controlchan | 1 | 0.0% | 0.1 KB | 0.0% |
| nocem | 1 | 0.0% | 0.0 KB | 0.0% |
| TOTAL: 7 | 8016 | 100.0% | 1022.9 KB | 100.0% |
History cache:
| Reason | Count | %Count |
|---|---|---|
| Do not exist | 2 | 40.0% |
| Negative hits | 2 | 40.0% |
| Positive hits | 1 | 20.0% |
| Cache misses | 0 | 0.0% |
| TOTAL: 4 | 5 | 100.0% |
INND timer:
| Code region | Time | Pct | Invoked | Min(ms) | Avg(ms) | Max(ms) |
|---|---|---|---|---|---|---|
| article cancel | 00:00:00.000 | 0.0% | 0 | 0.000 | 0.000 | 0.000 |
| article cleanup | 00:00:00.000 | 0.0% | 2 | 0.000 | 0.000 | 0.000 |
| article logging | 00:00:00.001 | 0.0% | 2 | 0.000 | 0.500 | 1.000 |
| article parse | 00:00:00.000 | 0.0% | 6 | 0.000 | 0.000 | 0.000 |
| article write | 00:00:00.001 | 0.0% | 2 | 0.000 | 0.500 | 1.000 |
| data move | 00:00:00.001 | 0.0% | 9 | 0.000 | 0.111 | 0.250 |
| history grep | 00:00:00.000 | 0.0% | 0 | 0.000 | 0.000 | 0.000 |
| history lookup | 00:00:00.001 | 0.0% | 5 | 0.000 | 0.200 | 0.500 |
| history sync | 00:00:00.003 | 0.0% | 431 | 0.000 | 0.007 | 0.333 |
| history write | 00:00:00.002 | 0.0% | 2 | 0.000 | 1.000 | 2.000 |
| idle | 24:01:27.712 | 100.0% | 1095 | 33339.500 | 78984.212 | 100168.000 |
| nntp read | 00:00:00.001 | 0.0% | 41 | 0.000 | 0.024 | 0.200 |
| overview write | 00:00:00.011 | 0.0% | 2 | 2.000 | 5.500 | 9.000 |
| perl filter | 00:00:00.099 | 0.0% | 2 | 16.000 | 49.500 | 83.000 |
| python filter | 00:00:00.000 | 0.0% | 4 | 0.000 | 0.000 | 0.000 |
| site send | 00:00:00.006 | 0.0% | 6 | 0.000 | 1.000 | 2.000 |
| TOTAL: 24:01:35.856 | 24:01:27.838 | 100.0% | - | - | - | - |
INNfeed timer:
| Code region | Time | Pct | Invoked | Min(ms) | Avg(ms) | Max(ms) |
|---|---|---|---|---|---|---|
| article new | 00:00:00.000 | 0.0% | 2 | 0.000 | 0.000 | 0.000 |
| article prepare | 00:00:00.000 | 0.0% | 8 | 0.000 | 0.000 | 0.000 |
| article read | 00:00:00.200 | 0.0% | 2 | 0.000 | 100.000 | 200.000 |
| backlog stats | 00:00:00.062 | 0.0% | 6246 | 0.000 | 0.010 | 0.083 |
| callbacks | 00:00:00.000 | 0.0% | 0 | 0.000 | 0.000 | 0.000 |
| data read | 00:00:00.001 | 0.0% | 15 | 0.000 | 0.067 | 0.200 |
| data write | 00:00:00.003 | 0.0% | 81 | 0.000 | 0.037 | 0.500 |
| idle | 23:52:47.486 | 99.9% | 6246 | 8814.882 | 13763.606 | 27445.609 |
| status file | 00:00:02.287 | 0.0% | 695 | 2.909 | 3.291 | 7.000 |
| TOTAL: 23:54:34.413 | 23:52:50.039 | 99.9% | - | - | - | - |
nnrpd timer:
| Code region | Time | Pct | Invoked | Min(ms) | Avg(ms) | Max(ms) |
|---|---|---|---|---|---|---|
| idle | 00:31:00.918 | 99.9% | 35 | 0.125 | 53169.086 | 169174.091 |
| newnews | 00:00:00.000 | 0.0% | 0 | 0.000 | 0.000 | 0.000 |
| nntpwrite | 00:00:00.005 | 0.0% | 33 | 0.111 | 0.152 | 0.333 |
| readart | 00:00:00.220 | 0.0% | 3 | 73.333 | 73.333 | 73.333 |
| TOTAL: 00:31:02.305 | 00:31:01.143 | 99.9% | - | - | - | - |
Control commands to INND:
| Command | Number |
|---|---|
| flush | 5 |
| flushlogs | 2 |
| go | 2 |
| logmode | 2 |
| lowmark | 1 |
| mode | 856 |
| name | 2 |
| pause | 2 |
| paused | 2 |
| reload | 2 |
| reserve | 2 |
| TOTAL: 11 | 878 |
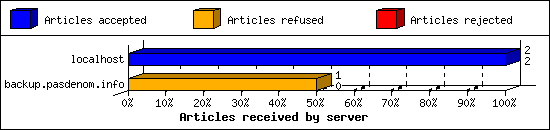
Incoming Feeds (INN):
| Server | Connects | Offered | Taken | Refused | Reject | %Accpt | Elapsed | |
|---|---|---|---|---|---|---|---|---|
| 1 | localhost | 28 | 2 | 2 | 0 | 0 | 100% | 00:00:00 |
| 2 | backup.pasdenom.info | 3 | 1 | 0 | 1 | 0 | 0% | 00:30:01 |
| TOTAL: 2 | 31 | 3 | 2 | 1 | 0 | 66% | 00:30:01 | |
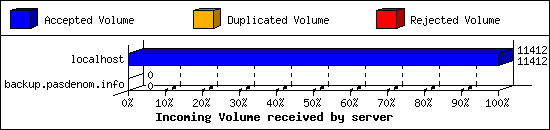
Incoming Volume (INN):
| Server | AcceptVol | DupVol | RejVol | TotalVol | %Acc | Vol/Art | |
|---|---|---|---|---|---|---|---|
| 1 | localhost | 11.1 KB | 0.0 KB | 0.0 KB | 11.1 KB | 100% | 5.6 KB |
| 2 | backup.pasdenom.info | 0.0 KB | 0.0 KB | 0.0 KB | 0.0 KB | 0% | 0 |
| TOTAL: 2 | 11.1 KB | 0.0 KB | 0.0 KB | 11.1 KB | 100% | 5.6 KB | |
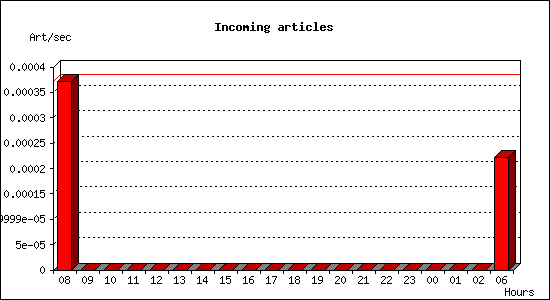
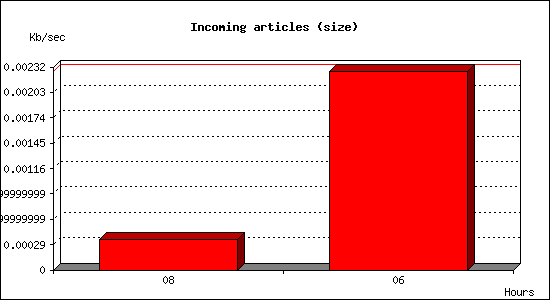
Incoming articles:
| Date | Articles | %Arts | Art/sec | Size | %Size | KB/sec |
|---|---|---|---|---|---|---|
| Sep 1 08:15:02 - 08:59:59 | 1 | 50.0% | 0.00 | 0.9 KB | 0.0% | 0.00 |
| Sep 1 09:00:00 - 09:59:59 | 0 | 0.0% | 0.00 | 0.0 KB | 0.0% | 0.00 |
| Sep 1 10:00:00 - 10:59:59 | 0 | 0.0% | 0.00 | 0.0 KB | 0.0% | 0.00 |
| Sep 1 11:00:00 - 11:59:59 | 0 | 0.0% | 0.00 | 0.0 KB | 0.0% | 0.00 |
| Sep 1 12:00:00 - 12:59:59 | 0 | 0.0% | 0.00 | 0.0 KB | 0.0% | 0.00 |
| Sep 1 13:00:00 - 13:59:59 | 0 | 0.0% | 0.00 | 0.0 KB | 0.0% | 0.00 |
| Sep 1 14:00:00 - 14:59:59 | 0 | 0.0% | 0.00 | 0.0 KB | 0.0% | 0.00 |
| Sep 1 15:00:00 - 15:59:59 | 0 | 0.0% | 0.00 | 0.0 KB | 0.0% | 0.00 |
| Sep 1 16:00:00 - 16:59:59 | 0 | 0.0% | 0.00 | 0.0 KB | 0.0% | 0.00 |
| Sep 1 17:00:00 - 17:59:59 | 0 | 0.0% | 0.00 | 0.0 KB | 0.0% | 0.00 |
| Sep 1 18:00:00 - 18:59:59 | 0 | 0.0% | 0.00 | 0.0 KB | 0.0% | 0.00 |
| Sep 1 19:00:00 - 19:59:59 | 0 | 0.0% | 0.00 | 0.0 KB | 0.0% | 0.00 |
| Sep 1 20:00:00 - 20:59:59 | 0 | 0.0% | 0.00 | 0.0 KB | 0.0% | 0.00 |
| Sep 1 21:00:00 - 21:59:59 | 0 | 0.0% | 0.00 | 0.0 KB | 0.0% | 0.00 |
| Sep 1 22:00:00 - 22:59:59 | 0 | 0.0% | 0.00 | 0.0 KB | 0.0% | 0.00 |
| Sep 1 23:00:00 - 23:59:59 | 0 | 0.0% | 0.00 | 0.0 KB | 0.0% | 0.00 |
| Sep 2 00:00:00 - 00:59:59 | 0 | 0.0% | 0.00 | 0.0 KB | 0.0% | 0.00 |
| Sep 2 01:00:00 - 01:59:59 | 0 | 0.0% | 0.00 | 0.0 KB | 0.0% | 0.00 |
| Sep 2 02:00:00 - 02:59:59 | 0 | 0.0% | 0.00 | 0.0 KB | 0.0% | 0.00 |
| Sep 2 03:00:00 - 06:15:02 | 1 | 50.0% | 0.00 | 10.2 KB | 0.0% | 0.00 |
| TOTAL: 20:00:00 | 2 | 100.0% | 0.00 | 0.0 KB | 100.0% | 0.00 |
CNFS buffer status:
| Buffer | Class | Size | Used | %Used | Cycles | KB/sec | Days |
|---|---|---|---|---|---|---|---|
| ALT1 | M_ALT | 1000.0 MB | 945.5 MB | 94.6% | 2 | 0.00 | 0.00 |
| ALTFR1 | M_ALTFR | 500.0 MB | 147.7 MB | 29.5% | 0 | 0.00 | 0.00 |
| BIG1 | M_BIG8 | 2.0 GB | 1.4 GB | 69.4% | 14 | 0.00 | 0.00 |
| BIG2 | M_BIG8 | 2.0 GB | 1.4 GB | 69.6% | 14 | 0.00 | 0.00 |
| BIG3 | M_BIG8 | 2.0 GB | 1.0 GB | 53.4% | 11 | 0.00 | 0.00 |
| BIN0 | M_BIN | 500.0 MB | 237.2 MB | 47.4% | 1 | 0.02 | 347.22 |
| CTRL1 | M_CTRL | 100.0 MB | 16.1 MB | 16.1% | 24 | 0.00 | 0.00 |
| EUROPE1 | M_EUR | 2.0 GB | 93.5 MB | 4.7% | 39 | 0.00 | 0.00 |
| FR1 | M_FR | 2.0 GB | 469.4 MB | 23.5% | 2 | 0.00 | 0.00 |
| FR2 | M_FR | 2.0 GB | 441.9 MB | 22.1% | 1 | 0.00 | 0.00 |
| FREE1 | M_FREE | 1000.0 MB | 393.9 MB | 39.4% | 23 | 0.00 | 0.00 |
| MAIL0 | M_MAIL | 500.0 MB | 197.6 MB | 39.5% | 27 | 0.00 | 0.00 |
| MHUU1 | M_MHUU | 2.0 GB | 817.5 MB | 40.9% | 35 | 0.00 | 0.00 |
| MHUU2 | M_MHUU | 2.0 GB | 832.6 MB | 41.6% | 26 | 0.00 | 0.00 |
| MIC0 | M_MIC | 100.0 MB | 174.1 KB | 0.2% | 12 | 0.00 | 0.00 |
| RUS1 | M_RUS | 2.0 GB | 1.5 GB | 78.8% | 8 | 0.00 | 0.00 |
| TEST | M_TEST | 500.0 MB | 458.1 MB | 91.6% | 13 | 0.00 | 0.00 |
| TOTAL: 17 | - | 21.7 GB | 10.2 GB | 47.2% | 252 | 0.02 | - |
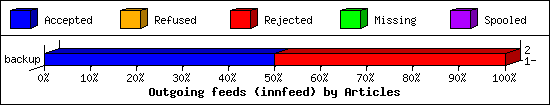
Outgoing Feeds (innfeed) by Articles:
| Server | Offered | Taken | Refused | Reject | Miss | Spool | %Took | Elapsed | |
|---|---|---|---|---|---|---|---|---|---|
| 1 | backup | 2 | 1 | 0 | 1 | 0 | 0 | 50% | 00:30:05 |
| 2 | free | 0 | 0 | 0 | 0 | 0 | 1 | 0% | 23:50:07 |
| 3 | gegeweb | 0 | 0 | 0 | 0 | 0 | 1 | 0% | 24:00:00 |
| 4 | csiph | 0 | 0 | 0 | 0 | 0 | 1 | 0% | 24:00:00 |
| 5 | tsukuba | 0 | 0 | 0 | 0 | 0 | 0 | 0% | 23:59:53 |
| 6 | nntp4 | 0 | 0 | 0 | 0 | 0 | 1 | 0% | 24:00:00 |
| 7 | tnet | 0 | 0 | 0 | 0 | 0 | 1 | 0% | 24:00:00 |
| 8 | izac | 0 | 0 | 0 | 0 | 0 | 1 | 0% | 24:00:00 |
| 9 | usenet-fr | 0 | 0 | 0 | 0 | 0 | 1 | 0% | 24:00:00 |
| 10 | ortolo | 0 | 0 | 0 | 0 | 0 | 1 | 0% | 24:00:00 |
| 11 | niel.me | 0 | 0 | 0 | 0 | 0 | 1 | 0% | 24:00:00 |
| 12 | linuxd | 0 | 0 | 0 | 0 | 0 | 1 | 0% | 23:59:53 |
| 13 | alphanet | 0 | 0 | 0 | 0 | 0 | 1 | 0% | 24:00:00 |
| 14 | dodin | 0 | 0 | 0 | 0 | 0 | 1 | 0% | 24:00:00 |
| 15 | httrack | 0 | 0 | 0 | 0 | 0 | 1 | 0% | 24:00:00 |
| 16 | bwh | 0 | 0 | 0 | 0 | 0 | 1 | 0% | 24:00:00 |
| 17 | bete-des-vosges | 0 | 0 | 0 | 0 | 0 | 1 | 0% | 24:00:00 |
| 18 | goja | 0 | 0 | 0 | 0 | 0 | 1 | 0% | 23:59:53 |
| 19 | aioe | 0 | 0 | 0 | 0 | 0 | 1 | 0% | 24:00:00 |
| 20 | birotanews | 0 | 0 | 0 | 0 | 0 | 1 | 0% | 24:00:00 |
| 21 | furie | 0 | 0 | 0 | 0 | 0 | 0 | 0% | 24:00:00 |
| 22 | weretis.net | 0 | 0 | 0 | 0 | 0 | 1 | 0% | 24:00:00 |
| TOTAL: 22 | 2 | 1 | 0 | 1 | 0 | 19 | 50% | 504:19:51 | |
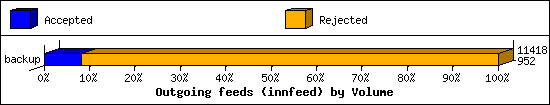
Outgoing Feeds (innfeed) by Volume:
| Server | AcceptVol | RejectVol | TotalVol | Volume/sec | Vol/Art | Elapsed | |
|---|---|---|---|---|---|---|---|
| 1 | backup | 0.9 KB | 10.2 KB | 11.2 KB | 0.0 KB/s | 5.6 KB | 00:30:05 |
| 2 | free | 0.0 KB | 0.0 KB | 0.0 KB | 0.0 KB/s | 0 | 23:50:07 |
| 3 | gegeweb | 0.0 KB | 0.0 KB | 0.0 KB | 0.0 KB/s | 0 | 24:00:00 |
| 4 | csiph | 0.0 KB | 0.0 KB | 0.0 KB | 0.0 KB/s | 0 | 24:00:00 |
| 5 | tsukuba | 0.0 KB | 0.0 KB | 0.0 KB | 0.0 KB/s | 0 | 23:59:53 |
| 6 | nntp4 | 0.0 KB | 0.0 KB | 0.0 KB | 0.0 KB/s | 0 | 24:00:00 |
| 7 | tnet | 0.0 KB | 0.0 KB | 0.0 KB | 0.0 KB/s | 0 | 24:00:00 |
| 8 | izac | 0.0 KB | 0.0 KB | 0.0 KB | 0.0 KB/s | 0 | 24:00:00 |
| 9 | usenet-fr | 0.0 KB | 0.0 KB | 0.0 KB | 0.0 KB/s | 0 | 24:00:00 |
| 10 | ortolo | 0.0 KB | 0.0 KB | 0.0 KB | 0.0 KB/s | 0 | 24:00:00 |
| 11 | niel.me | 0.0 KB | 0.0 KB | 0.0 KB | 0.0 KB/s | 0 | 24:00:00 |
| 12 | linuxd | 0.0 KB | 0.0 KB | 0.0 KB | 0.0 KB/s | 0 | 23:59:53 |
| 13 | alphanet | 0.0 KB | 0.0 KB | 0.0 KB | 0.0 KB/s | 0 | 24:00:00 |
| 14 | dodin | 0.0 KB | 0.0 KB | 0.0 KB | 0.0 KB/s | 0 | 24:00:00 |
| 15 | httrack | 0.0 KB | 0.0 KB | 0.0 KB | 0.0 KB/s | 0 | 24:00:00 |
| 16 | bwh | 0.0 KB | 0.0 KB | 0.0 KB | 0.0 KB/s | 0 | 24:00:00 |
| 17 | bete-des-vosges | 0.0 KB | 0.0 KB | 0.0 KB | 0.0 KB/s | 0 | 24:00:00 |
| 18 | goja | 0.0 KB | 0.0 KB | 0.0 KB | 0.0 KB/s | 0 | 23:59:53 |
| 19 | aioe | 0.0 KB | 0.0 KB | 0.0 KB | 0.0 KB/s | 0 | 24:00:00 |
| 20 | birotanews | 0.0 KB | 0.0 KB | 0.0 KB | 0.0 KB/s | 0 | 24:00:00 |
| 21 | furie | 0.0 KB | 0.0 KB | 0.0 KB | 0.0 KB/s | 0 | 24:00:00 |
| 22 | weretis.net | 0.0 KB | 0.0 KB | 0.0 KB | 0.0 KB/s | 0 | 24:00:00 |
| TOTAL: 22 | 0.9 KB | 10.2 KB | 11.2 KB | 0.0 KB/s | 5.6 KB | 504:19:51 | |
NNRP readership statistics:
| System | Conn | Arts | Size | Groups | Post | Rej | Elapsed | |
|---|---|---|---|---|---|---|---|---|
| 1 | 192.168.0.2 | 1 | 3 | 2.9 KB | 2 | 1 | 0 | 00:31:01 |
| 2 | localhost | 1 | 0 | 0.0 KB | 0 | 1 | 0 | 00:00:00 |
| TOTAL: 2 | 2 | 3 | 2.9 KB | 2 | 2 | 0 | 00:31:02 | |
NNRP readership statistics (by domain):
| System | Conn | Arts | Size | Groups | Post | Rej | Elapsed | |
|---|---|---|---|---|---|---|---|---|
| 1 | unresolved | 1 | 3 | 2.9 KB | 2 | 1 | 0 | 00:31:01 |
| 2 | ? | 1 | 0 | 0.0 KB | 0 | 1 | 0 | 00:00:00 |
| TOTAL: 2 | 2 | 3 | 2.9 KB | 2 | 2 | 0 | 00:31:02 | |
NNRP total resource statistics [Top 20]:
| System | User(ms) | System(ms) | Idle(ms) | Elapsed |
|---|---|---|---|---|
| 192.168.0.2 | 0.586 | 0.131 | 0.000 | 00:31:01 |
| localhost | 0.381 | 0.110 | 0.000 | 00:00:00 |
| TOTAL: 2 | 0.967 | 0.241 | 0.000 | 00:31:02 |
NNRP client timeouts [Top 20]:
| System | Conn | Peer |
|---|---|---|
| 192.168.0.2 | 1 | 0 |
| TOTAL: 1 | 1 | 0 |
Newsgroup request counts (by category):
| Category | Count | Pct | |
|---|---|---|---|
| 1 | fr | 3 | 100.0% |
| TOTAL: 1 | 3 | 100.0% | |
Newsgroup request counts (by newsgroup) [Top 200]:
| Newsgroup | Count | |
|---|---|---|
| 1 | fr.test | 3 |
| TOTAL: 1 | 3 | |