Unknown entries from news log file:
First 12 / 12 lines (100.0%)
Log entries by program:
| Program name | Lines | %Lines | Size | %Size |
|---|---|---|---|---|
| innfeed | 4521 | 48.9% | 441.3 KB | 38.9% |
| cnfsstat | 2567 | 27.8% | 456.7 KB | 40.2% |
| innd | 1933 | 20.9% | 216.7 KB | 19.1% |
| nnrpd | 197 | 2.1% | 17.7 KB | 1.6% |
| inn | 12 | 0.1% | 1.8 KB | 0.2% |
| controlchan | 7 | 0.1% | 0.4 KB | 0.0% |
| nocem | 6 | 0.1% | 0.4 KB | 0.0% |
| TOTAL: 7 | 9243 | 100.0% | 1.1 MB | 100.0% |
History cache:
| Reason | Count | %Count |
|---|---|---|
| Cache misses | 2376 | 99.6% |
| Do not exist | 4 | 0.2% |
| Negative hits | 3 | 0.1% |
| Positive hits | 3 | 0.1% |
| TOTAL: 4 | 2386 | 100.0% |
INND timer:
| Code region | Time | Pct | Invoked | Min(ms) | Avg(ms) | Max(ms) |
|---|---|---|---|---|---|---|
| artcncl/perl | 00:00:00.000 | 0.0% | 0 | 0.000 | 0.000 | 0.000 |
| article cancel | 00:00:00.064 | 0.0% | 12 | 0.000 | 5.333 | 19.000 |
| article cleanup | 00:00:00.000 | 0.0% | 3 | 0.000 | 0.000 | 0.000 |
| article logging | 00:00:00.000 | 0.0% | 3 | 0.000 | 0.000 | 0.000 |
| article parse | 00:00:00.001 | 0.0% | 8 | 0.000 | 0.125 | 0.250 |
| article write | 00:00:00.002 | 0.0% | 3 | 0.000 | 0.667 | 1.000 |
| artlog/artcncl | 00:00:00.000 | 0.0% | 9 | 0.000 | 0.000 | 0.000 |
| artlog/artcncl/perl | 00:00:00.000 | 0.0% | 0 | 0.000 | 0.000 | 0.000 |
| data move | 00:00:00.002 | 0.0% | 1162 | 0.000 | 0.002 | 0.002 |
| hisgrep/artcncl | 00:00:00.003 | 0.0% | 11 | 0.000 | 0.273 | 0.667 |
| hisgrep/artcncl/perl | 00:00:00.000 | 0.0% | 0 | 0.000 | 0.000 | 0.000 |
| hisgrep/perl | 00:00:00.000 | 0.0% | 0 | 0.000 | 0.000 | 0.000 |
| hishave/artcncl | 00:00:00.002 | 0.0% | 12 | 0.000 | 0.167 | 0.500 |
| hishave/artcncl/perl | 00:00:00.000 | 0.0% | 0 | 0.000 | 0.000 | 0.000 |
| history grep | 00:00:00.000 | 0.0% | 0 | 0.000 | 0.000 | 0.000 |
| history lookup | 00:00:01.150 | 0.0% | 2374 | 0.000 | 0.484 | 0.500 |
| history sync | 00:00:00.002 | 0.0% | 430 | 0.000 | 0.005 | 0.333 |
| history write | 00:00:00.001 | 0.0% | 3 | 0.000 | 0.333 | 1.000 |
| hiswrite/artcncl | 00:00:00.001 | 0.0% | 1 | 1.000 | 1.000 | 1.000 |
| hiswrite/artcncl/perl | 00:00:00.000 | 0.0% | 0 | 0.000 | 0.000 | 0.000 |
| idle | 24:11:15.363 | 100.0% | 2357 | 523.859 | 36943.302 | 100157.833 |
| nntp read | 00:00:00.028 | 0.0% | 1218 | 0.000 | 0.023 | 0.053 |
| overview write | 00:00:00.014 | 0.0% | 3 | 1.000 | 4.667 | 6.500 |
| perl filter | 00:00:00.241 | 0.0% | 3 | 62.000 | 80.333 | 117.000 |
| python filter | 00:00:00.000 | 0.0% | 6 | 0.000 | 0.000 | 0.000 |
| site send | 00:00:00.043 | 0.0% | 11 | 0.000 | 3.909 | 5.375 |
| TOTAL: 24:11:35.909 | 24:11:16.917 | 100.0% | - | - | - | - |
INNfeed timer:
| Code region | Time | Pct | Invoked | Min(ms) | Avg(ms) | Max(ms) |
|---|---|---|---|---|---|---|
| article new | 00:00:00.015 | 0.0% | 2784 | 0.000 | 0.005 | 0.006 |
| article prepare | 00:00:00.020 | 0.0% | 10824 | 0.002 | 0.002 | 0.004 |
| article read | 00:00:00.963 | 0.0% | 2750 | 0.288 | 0.350 | 0.728 |
| backlog stats | 00:00:00.072 | 0.0% | 15869 | 0.000 | 0.005 | 0.071 |
| callbacks | 00:00:00.003 | 0.0% | 82 | 0.000 | 0.037 | 0.043 |
| data read | 00:00:00.176 | 0.0% | 4796 | 0.000 | 0.037 | 0.038 |
| data write | 00:00:00.285 | 0.0% | 4804 | 0.000 | 0.059 | 0.063 |
| idle | 24:04:35.216 | 99.8% | 15869 | 72.674 | 5461.920 | 26088.261 |
| prepart/cb | 00:00:00.000 | 0.0% | 44 | 0.000 | 0.000 | 0.000 |
| readart/cb | 00:00:00.002 | 0.0% | 11 | 0.182 | 0.182 | 0.182 |
| status file | 00:00:03.136 | 0.0% | 968 | 2.727 | 3.240 | 15.000 |
| TOTAL: 24:06:56.378 | 24:04:39.888 | 99.8% | - | - | - | - |
nnrpd timer:
| Code region | Time | Pct | Invoked | Min(ms) | Avg(ms) | Max(ms) |
|---|---|---|---|---|---|---|
| hisgrep | 00:00:00.020 | 0.0% | 21 | 0.000 | 0.952 | 2.000 |
| idle | 02:21:56.175 | 99.8% | 176 | 0.000 | 48387.358 | 600105.000 |
| newnews | 00:00:00.000 | 0.0% | 0 | 0.000 | 0.000 | 0.000 |
| nntpwrite | 00:00:02.568 | 0.0% | 57967 | 0.000 | 0.044 | 67.286 |
| readart | 00:00:00.035 | 0.0% | 36 | 0.000 | 0.972 | 2.000 |
| TOTAL: 02:22:13.810 | 02:21:58.798 | 99.8% | - | - | - | - |
Control commands to INND:
| Command | Number |
|---|---|
| cancel | 12 |
| flush | 5 |
| flushlogs | 2 |
| go | 2 |
| logmode | 2 |
| lowmark | 1 |
| mode | 887 |
| name | 2 |
| pause | 2 |
| paused | 2 |
| reload | 8 |
| reserve | 2 |
| TOTAL: 12 | 927 |
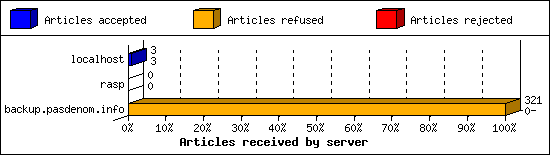
Incoming Feeds (INN):
| Server | Connects | Offered | Taken | Refused | Reject | %Accpt | Elapsed | |
|---|---|---|---|---|---|---|---|---|
| 1 | localhost | 49 | 3 | 3 | 0 | 0 | 100% | 00:00:00 |
| 2 | rasp | 3 | 0 | 0 | 0 | 0 | 0% | 00:00:00 |
| 3 | backup.pasdenom.info | 6 | 321 | 0 | 321 | 0 | 0% | 00:26:01 |
| TOTAL: 3 | 58 | 324 | 3 | 321 | 0 | 0% | 00:26:01 | |
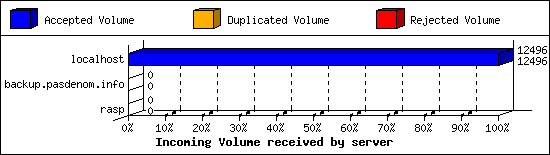
Incoming Volume (INN):
| Server | AcceptVol | DupVol | RejVol | TotalVol | %Acc | Vol/Art | |
|---|---|---|---|---|---|---|---|
| 1 | localhost | 12.2 KB | 0.0 KB | 0.0 KB | 12.2 KB | 100% | 4.1 KB |
| 2 | rasp | 0.0 KB | 0.0 KB | 0.0 KB | 0.0 KB | 0% | 0 |
| 3 | backup.pasdenom.info | 0.0 KB | 0.0 KB | 0.0 KB | 0.0 KB | 0% | 0 |
| TOTAL: 3 | 12.2 KB | 0.0 KB | 0.0 KB | 12.2 KB | 100% | 4.1 KB | |
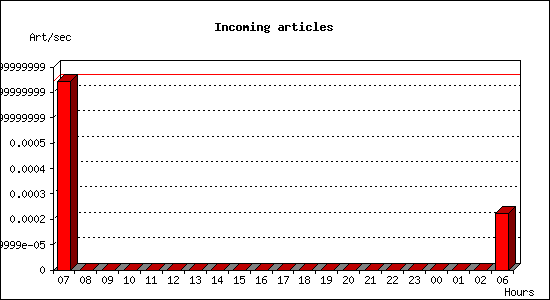
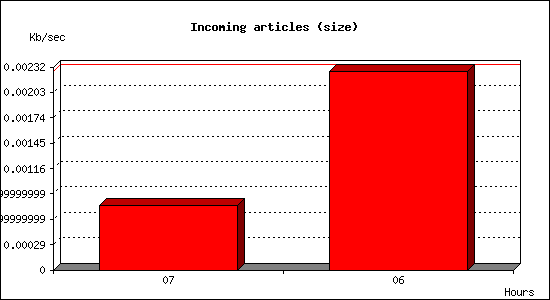
Incoming articles:
| Date | Articles | %Arts | Art/sec | Size | %Size | KB/sec |
|---|---|---|---|---|---|---|
| Aug 29 07:15:02 - 07:59:59 | 2 | 66.7% | 0.00 | 2.0 KB | 0.0% | 0.00 |
| Aug 29 08:00:00 - 08:59:59 | 0 | 0.0% | 0.00 | 0.0 KB | 0.0% | 0.00 |
| Aug 29 09:00:00 - 09:59:59 | 0 | 0.0% | 0.00 | 0.0 KB | 0.0% | 0.00 |
| Aug 29 10:00:00 - 10:59:59 | 0 | 0.0% | 0.00 | 0.0 KB | 0.0% | 0.00 |
| Aug 29 11:00:00 - 11:59:59 | 0 | 0.0% | 0.00 | 0.0 KB | 0.0% | 0.00 |
| Aug 29 12:00:00 - 12:59:59 | 0 | 0.0% | 0.00 | 0.0 KB | 0.0% | 0.00 |
| Aug 29 13:00:00 - 13:59:59 | 0 | 0.0% | 0.00 | 0.0 KB | 0.0% | 0.00 |
| Aug 29 14:00:00 - 14:59:59 | 0 | 0.0% | 0.00 | 0.0 KB | 0.0% | 0.00 |
| Aug 29 15:00:00 - 15:59:59 | 0 | 0.0% | 0.00 | 0.0 KB | 0.0% | 0.00 |
| Aug 29 16:00:00 - 16:59:59 | 0 | 0.0% | 0.00 | 0.0 KB | 0.0% | 0.00 |
| Aug 29 17:00:00 - 17:59:59 | 0 | 0.0% | 0.00 | 0.0 KB | 0.0% | 0.00 |
| Aug 29 18:00:00 - 18:59:59 | 0 | 0.0% | 0.00 | 0.0 KB | 0.0% | 0.00 |
| Aug 29 19:00:00 - 19:59:59 | 0 | 0.0% | 0.00 | 0.0 KB | 0.0% | 0.00 |
| Aug 29 20:00:00 - 20:59:59 | 0 | 0.0% | 0.00 | 0.0 KB | 0.0% | 0.00 |
| Aug 29 21:00:00 - 21:59:59 | 0 | 0.0% | 0.00 | 0.0 KB | 0.0% | 0.00 |
| Aug 29 22:00:00 - 22:59:59 | 0 | 0.0% | 0.00 | 0.0 KB | 0.0% | 0.00 |
| Aug 29 23:00:00 - 23:59:59 | 0 | 0.0% | 0.00 | 0.0 KB | 0.0% | 0.00 |
| Aug 30 00:00:00 - 00:59:59 | 0 | 0.0% | 0.00 | 0.0 KB | 0.0% | 0.00 |
| Aug 30 01:00:00 - 01:59:59 | 0 | 0.0% | 0.00 | 0.0 KB | 0.0% | 0.00 |
| Aug 30 02:00:00 - 02:59:59 | 0 | 0.0% | 0.00 | 0.0 KB | 0.0% | 0.00 |
| Aug 30 03:00:00 - 06:15:02 | 1 | 33.3% | 0.00 | 10.2 KB | 0.0% | 0.00 |
| TOTAL: 21:00:00 | 3 | 100.0% | 0.00 | 0.0 KB | 100.0% | 0.00 |
CNFS buffer status:
| Buffer | Class | Size | Used | %Used | Cycles | KB/sec | Days |
|---|---|---|---|---|---|---|---|
| ALT1 | M_ALT | 1000.0 MB | 945.5 MB | 94.6% | 2 | 0.00 | 0.00 |
| ALTFR1 | M_ALTFR | 500.0 MB | 147.7 MB | 29.5% | 0 | 0.02 | 347.22 |
| BIG1 | M_BIG8 | 2.0 GB | 1.4 GB | 69.4% | 14 | 0.00 | 0.00 |
| BIG2 | M_BIG8 | 2.0 GB | 1.4 GB | 69.6% | 14 | 0.00 | 0.00 |
| BIG3 | M_BIG8 | 2.0 GB | 1.0 GB | 53.4% | 11 | 0.00 | 0.00 |
| BIN0 | M_BIN | 500.0 MB | 237.2 MB | 47.4% | 1 | 0.02 | 347.80 |
| CTRL1 | M_CTRL | 100.0 MB | 16.1 MB | 16.1% | 24 | 0.00 | 0.00 |
| EUROPE1 | M_EUR | 2.0 GB | 93.5 MB | 4.7% | 39 | 0.00 | 0.00 |
| FR1 | M_FR | 2.0 GB | 469.4 MB | 23.5% | 2 | 0.00 | 0.00 |
| FR2 | M_FR | 2.0 GB | 441.9 MB | 22.1% | 1 | 0.00 | 0.00 |
| FREE1 | M_FREE | 1000.0 MB | 393.9 MB | 39.4% | 23 | 0.00 | 0.00 |
| MAIL0 | M_MAIL | 500.0 MB | 197.6 MB | 39.5% | 27 | 0.00 | 0.00 |
| MHUU1 | M_MHUU | 2.0 GB | 817.5 MB | 40.9% | 35 | 0.00 | 0.00 |
| MHUU2 | M_MHUU | 2.0 GB | 832.6 MB | 41.6% | 26 | 0.00 | 0.00 |
| MIC0 | M_MIC | 100.0 MB | 174.1 KB | 0.2% | 12 | 0.00 | 0.00 |
| RUS1 | M_RUS | 2.0 GB | 1.5 GB | 78.8% | 8 | 0.00 | 0.00 |
| TEST | M_TEST | 500.0 MB | 458.1 MB | 91.6% | 13 | 0.00 | 0.00 |
| TOTAL: 17 | - | 21.7 GB | 10.2 GB | 47.2% | 252 | 0.02 | - |
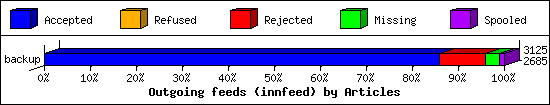
Outgoing Feeds (innfeed) by Articles:
| Server | Offered | Taken | Refused | Reject | Miss | Spool | %Took | Elapsed | |
|---|---|---|---|---|---|---|---|---|---|
| 1 | backup | 3179 | 2685 | 0 | 317 | 90 | 33 | 84% | 17:38:47 |
| 2 | csiph | 0 | 0 | 0 | 0 | 0 | 1 | 0% | 24:17:26 |
| 3 | ortolo | 0 | 0 | 0 | 0 | 0 | 1 | 0% | 24:17:26 |
| 4 | izac | 0 | 0 | 0 | 0 | 0 | 1 | 0% | 24:17:26 |
| 5 | bete-des-vosges | 0 | 0 | 0 | 0 | 0 | 1 | 0% | 24:17:26 |
| 6 | dodin | 0 | 0 | 0 | 0 | 0 | 1 | 0% | 24:17:26 |
| 7 | goja | 0 | 0 | 0 | 0 | 0 | 1 | 0% | 24:17:18 |
| 8 | nntp4 | 0 | 0 | 0 | 0 | 0 | 1 | 0% | 24:17:26 |
| 9 | free | 0 | 0 | 0 | 0 | 0 | 1 | 0% | 24:17:26 |
| 10 | birotanews | 0 | 0 | 0 | 0 | 0 | 1 | 0% | 24:17:26 |
| 11 | aioe | 0 | 0 | 0 | 0 | 0 | 1 | 0% | 24:17:26 |
| 12 | linuxd | 0 | 0 | 0 | 0 | 0 | 1 | 0% | 24:17:18 |
| 13 | usenet-fr | 0 | 0 | 0 | 0 | 0 | 1 | 0% | 24:17:26 |
| 14 | bwh | 0 | 0 | 0 | 0 | 0 | 1 | 0% | 24:17:26 |
| 15 | httrack | 0 | 0 | 0 | 0 | 0 | 1 | 0% | 24:17:26 |
| 16 | alphanet | 0 | 0 | 0 | 0 | 0 | 1 | 0% | 24:17:26 |
| 17 | niel.me | 0 | 0 | 0 | 0 | 0 | 1 | 0% | 24:17:26 |
| 18 | tsukuba | 0 | 0 | 0 | 0 | 0 | 0 | 0% | 24:17:14 |
| 19 | furie | 0 | 0 | 0 | 0 | 0 | 0 | 0% | 24:17:26 |
| 20 | tnet | 0 | 0 | 0 | 0 | 0 | 1 | 0% | 24:17:26 |
| 21 | weretis.net | 0 | 0 | 0 | 0 | 0 | 1 | 0% | 24:17:26 |
| 22 | gegeweb | 0 | 0 | 0 | 0 | 0 | 1 | 0% | 24:17:26 |
| TOTAL: 22 | 3179 | 2685 | 0 | 317 | 90 | 52 | 84% | 527:44:25 | |
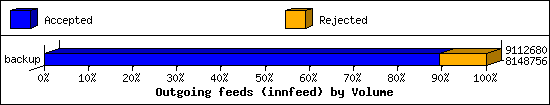
Outgoing Feeds (innfeed) by Volume:
| Server | AcceptVol | RejectVol | TotalVol | Volume/sec | Vol/Art | Elapsed | |
|---|---|---|---|---|---|---|---|
| 1 | backup | 7.8 MB | 941.3 KB | 8.7 MB | 0.1 KB/s | 3.0 KB | 17:38:47 |
| 2 | csiph | 0.0 KB | 0.0 KB | 0.0 KB | 0.0 KB/s | 0 | 24:17:26 |
| 3 | ortolo | 0.0 KB | 0.0 KB | 0.0 KB | 0.0 KB/s | 0 | 24:17:26 |
| 4 | izac | 0.0 KB | 0.0 KB | 0.0 KB | 0.0 KB/s | 0 | 24:17:26 |
| 5 | bete-des-vosges | 0.0 KB | 0.0 KB | 0.0 KB | 0.0 KB/s | 0 | 24:17:26 |
| 6 | dodin | 0.0 KB | 0.0 KB | 0.0 KB | 0.0 KB/s | 0 | 24:17:26 |
| 7 | goja | 0.0 KB | 0.0 KB | 0.0 KB | 0.0 KB/s | 0 | 24:17:18 |
| 8 | nntp4 | 0.0 KB | 0.0 KB | 0.0 KB | 0.0 KB/s | 0 | 24:17:26 |
| 9 | free | 0.0 KB | 0.0 KB | 0.0 KB | 0.0 KB/s | 0 | 24:17:26 |
| 10 | birotanews | 0.0 KB | 0.0 KB | 0.0 KB | 0.0 KB/s | 0 | 24:17:26 |
| 11 | aioe | 0.0 KB | 0.0 KB | 0.0 KB | 0.0 KB/s | 0 | 24:17:26 |
| 12 | linuxd | 0.0 KB | 0.0 KB | 0.0 KB | 0.0 KB/s | 0 | 24:17:18 |
| 13 | usenet-fr | 0.0 KB | 0.0 KB | 0.0 KB | 0.0 KB/s | 0 | 24:17:26 |
| 14 | bwh | 0.0 KB | 0.0 KB | 0.0 KB | 0.0 KB/s | 0 | 24:17:26 |
| 15 | httrack | 0.0 KB | 0.0 KB | 0.0 KB | 0.0 KB/s | 0 | 24:17:26 |
| 16 | alphanet | 0.0 KB | 0.0 KB | 0.0 KB | 0.0 KB/s | 0 | 24:17:26 |
| 17 | niel.me | 0.0 KB | 0.0 KB | 0.0 KB | 0.0 KB/s | 0 | 24:17:26 |
| 18 | tsukuba | 0.0 KB | 0.0 KB | 0.0 KB | 0.0 KB/s | 0 | 24:17:14 |
| 19 | furie | 0.0 KB | 0.0 KB | 0.0 KB | 0.0 KB/s | 0 | 24:17:26 |
| 20 | tnet | 0.0 KB | 0.0 KB | 0.0 KB | 0.0 KB/s | 0 | 24:17:26 |
| 21 | weretis.net | 0.0 KB | 0.0 KB | 0.0 KB | 0.0 KB/s | 0 | 24:17:26 |
| 22 | gegeweb | 0.0 KB | 0.0 KB | 0.0 KB | 0.0 KB/s | 0 | 24:17:26 |
| TOTAL: 22 | 7.8 MB | 941.3 KB | 8.7 MB | 0.0 KB/s | 3.0 KB | 527:44:25 | |
NNRP readership statistics:
| System | Conn | Arts | Size | Groups | Post | Rej | Elapsed | |
|---|---|---|---|---|---|---|---|---|
| 1 | localhost | 21 | 15 | 30.4 KB | 0 | 1 | 0 | 00:00:09 |
| 2 | 192.168.0.2 | 6 | 14 | 27.7 KB | 13 | 0 | 0 | 01:45:46 |
| 3 | 192.168.0.32 | 1 | 6 | 7.2 KB | 6 | 2 | 0 | 00:36:14 |
| 4 | rasp | 3 | 1 | 1.5 KB | 0 | 0 | 0 | 00:00:01 |
| TOTAL: 4 | 31 | 36 | 66.8 KB | 19 | 3 | 0 | 02:22:12 | |
NNRP readership statistics (by domain):
| System | Conn | Arts | Size | Groups | Post | Rej | Elapsed | |
|---|---|---|---|---|---|---|---|---|
| 1 | unresolved | 7 | 20 | 34.9 KB | 19 | 2 | 0 | 02:22:01 |
| 2 | ? | 24 | 16 | 31.9 KB | 0 | 1 | 0 | 00:00:10 |
| TOTAL: 2 | 31 | 36 | 66.8 KB | 19 | 3 | 0 | 02:22:12 | |
NNRP total resource statistics [Top 20]:
| System | User(ms) | System(ms) | Idle(ms) | Elapsed |
|---|---|---|---|---|
| 192.168.0.2 | 2.372 | 0.568 | 0.000 | 01:45:46 |
| 192.168.0.32 | 0.694 | 0.945 | 0.000 | 00:36:14 |
| localhost | 7.439 | 1.356 | 0.212 | 00:00:09 |
| rasp | 1.094 | 0.161 | 0.026 | 00:00:01 |
| TOTAL: 4 | 11.599 | 3.030 | 0.238 | 02:22:12 |
NNRP client timeouts [Top 20]:
| System | Conn | Peer |
|---|---|---|
| 192.168.0.2 | 2 | 0 |
| 192.168.0.32 | 1 | 0 |
| TOTAL: 2 | 3 | 0 |
Newsgroup request counts (by category):
| Category | Count | Pct | |
|---|---|---|---|
| 1 | soc | 12 | 60.0% |
| 2 | fr | 5 | 25.0% |
| 3 | nemo | 2 | 10.0% |
| 4 | local | 1 | 5.0% |
| TOTAL: 4 | 20 | 100.0% | |
Newsgroup request counts (by newsgroup) [Top 200]:
| Newsgroup | Count | |
|---|---|---|
| 1 | soc.women | 12 |
| 2 | fr.test | 5 |
| 3 | nemo.dev.passerelle | 2 |
| 4 | local.spam.fr | 1 |
| TOTAL: 4 | 20 | |